Traffic Tab
The Traffic tab controls the animated vehicle traffic flowing through your city roads.
Overview
Traffic in WhookTown consists of Tron-style vehicles that travel along roads:
- Light Cycles (60% of vehicles) - Motorcycles with glowing trails
- Data Packets (40% of vehicles) - Animated cubes representing data flow
Traffic is purely visual and doesn't represent actual network data (unless you create workflows to control it based on real metrics).
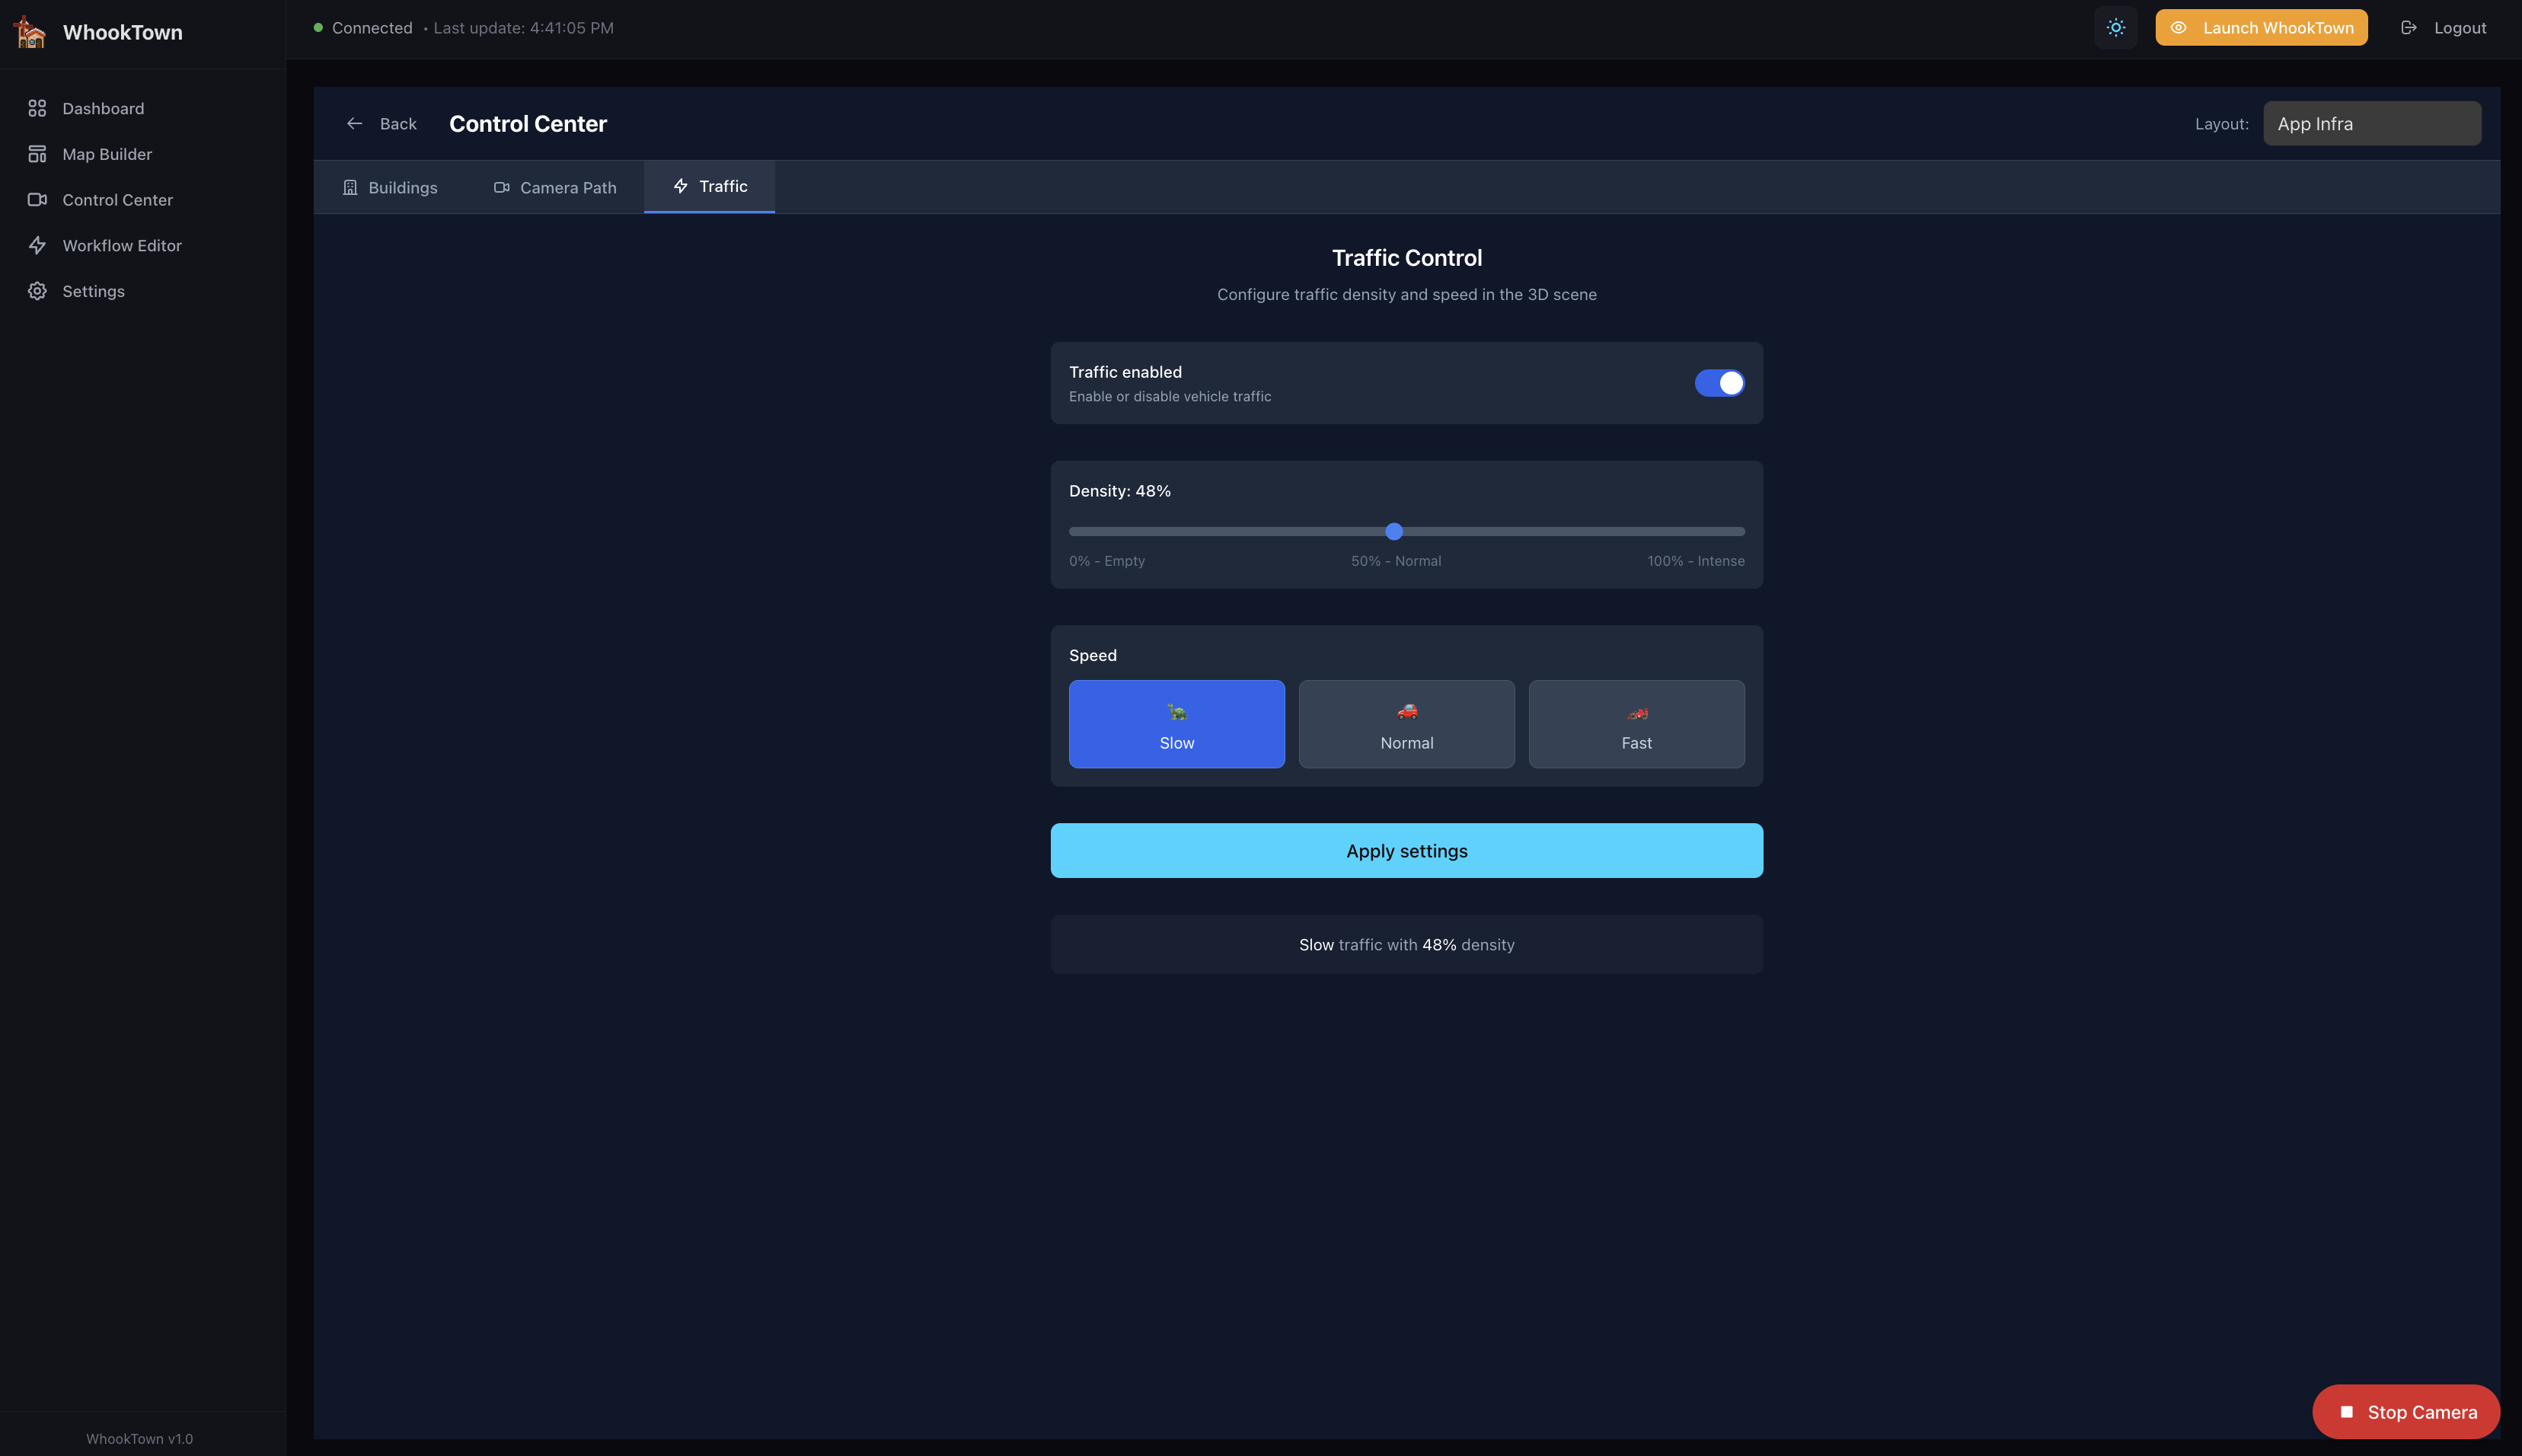
Traffic Controls
Traffic Enabled
Toggle to enable or disable all traffic:
- On - Vehicles spawn and move along roads
- Off - All vehicles are removed
Density
The density slider controls how many vehicles appear:
| Density | Vehicles | Description |
|---|---|---|
| 0% | 0 | Empty - no traffic |
| 25% | ~8 | Light traffic |
| 50% | ~15 | Normal traffic |
| 75% | ~22 | Heavy traffic |
| 100% | 30 | Maximum (intense) |
The slider labels show: - 0% - Empty - 50% - Normal - 100% - Intense
Speed
Three speed presets control how fast vehicles move:
| Speed | Multiplier | Description |
|---|---|---|
| Slow 🐢 | 0.5x | Leisurely pace (0.75 units/sec) |
| Normal 🚗 | 1.0x | Standard speed (1.5 units/sec) |
| Fast 🏎️ | 2.0x | Rapid movement (3.0 units/sec) |
Apply Settings
Click Apply settings to send the traffic configuration to all connected scenes.
Current State Display
Below the controls, the current state is displayed:
"Slow traffic with 48% density"
This confirms what settings are currently active.
Vehicle Behavior
Light Cycles
- Sleek motorcycle shape with neon glow
- Leave a glowing trail behind them (50 points)
- Colors alternate between cyan and magenta
- Trail fades over distance
Data Packets
- Small glowing cubes
- Colors: cyan, magenta, or neon green
- Rotate while moving
- Represent data flowing through your infrastructure
Path Following
Vehicles:
- Spawn at random road cells
- Follow connected roads automatically
- Use smooth curved paths (Catmull-Rom interpolation)
- Disappear at path ends
- New vehicles spawn to maintain density
Maximum Vehicles
The system caps at 30 vehicles simultaneously to maintain performance.
Use Cases
Representing Network Traffic
Use workflows to map real network metrics to traffic:
High network load → High density, Fast speed
Normal operation → Medium density, Normal speed
Low activity → Low density, Slow speed
Maintenance mode → Disabled
Visual Ambiance
Even without data integration, traffic adds life to your city:
- Enable during demos for visual appeal
- Adjust density based on audience
- Slow speed for calm presentations
- Fast speed for energetic demos
Incident Visualization
Combine with building states:
- Critical building → Disable traffic in that area
- Recovery → Gradually restore traffic
Tips
Roads required
Traffic only appears if you have roads in your layout. Draw roads in the Map Builder first.
Performance
Very high density (90-100%) may impact performance on older devices. Start with 50% and adjust.