Welcome to WhookTown
Visualize your IT infrastructure as a 3D virtual city.
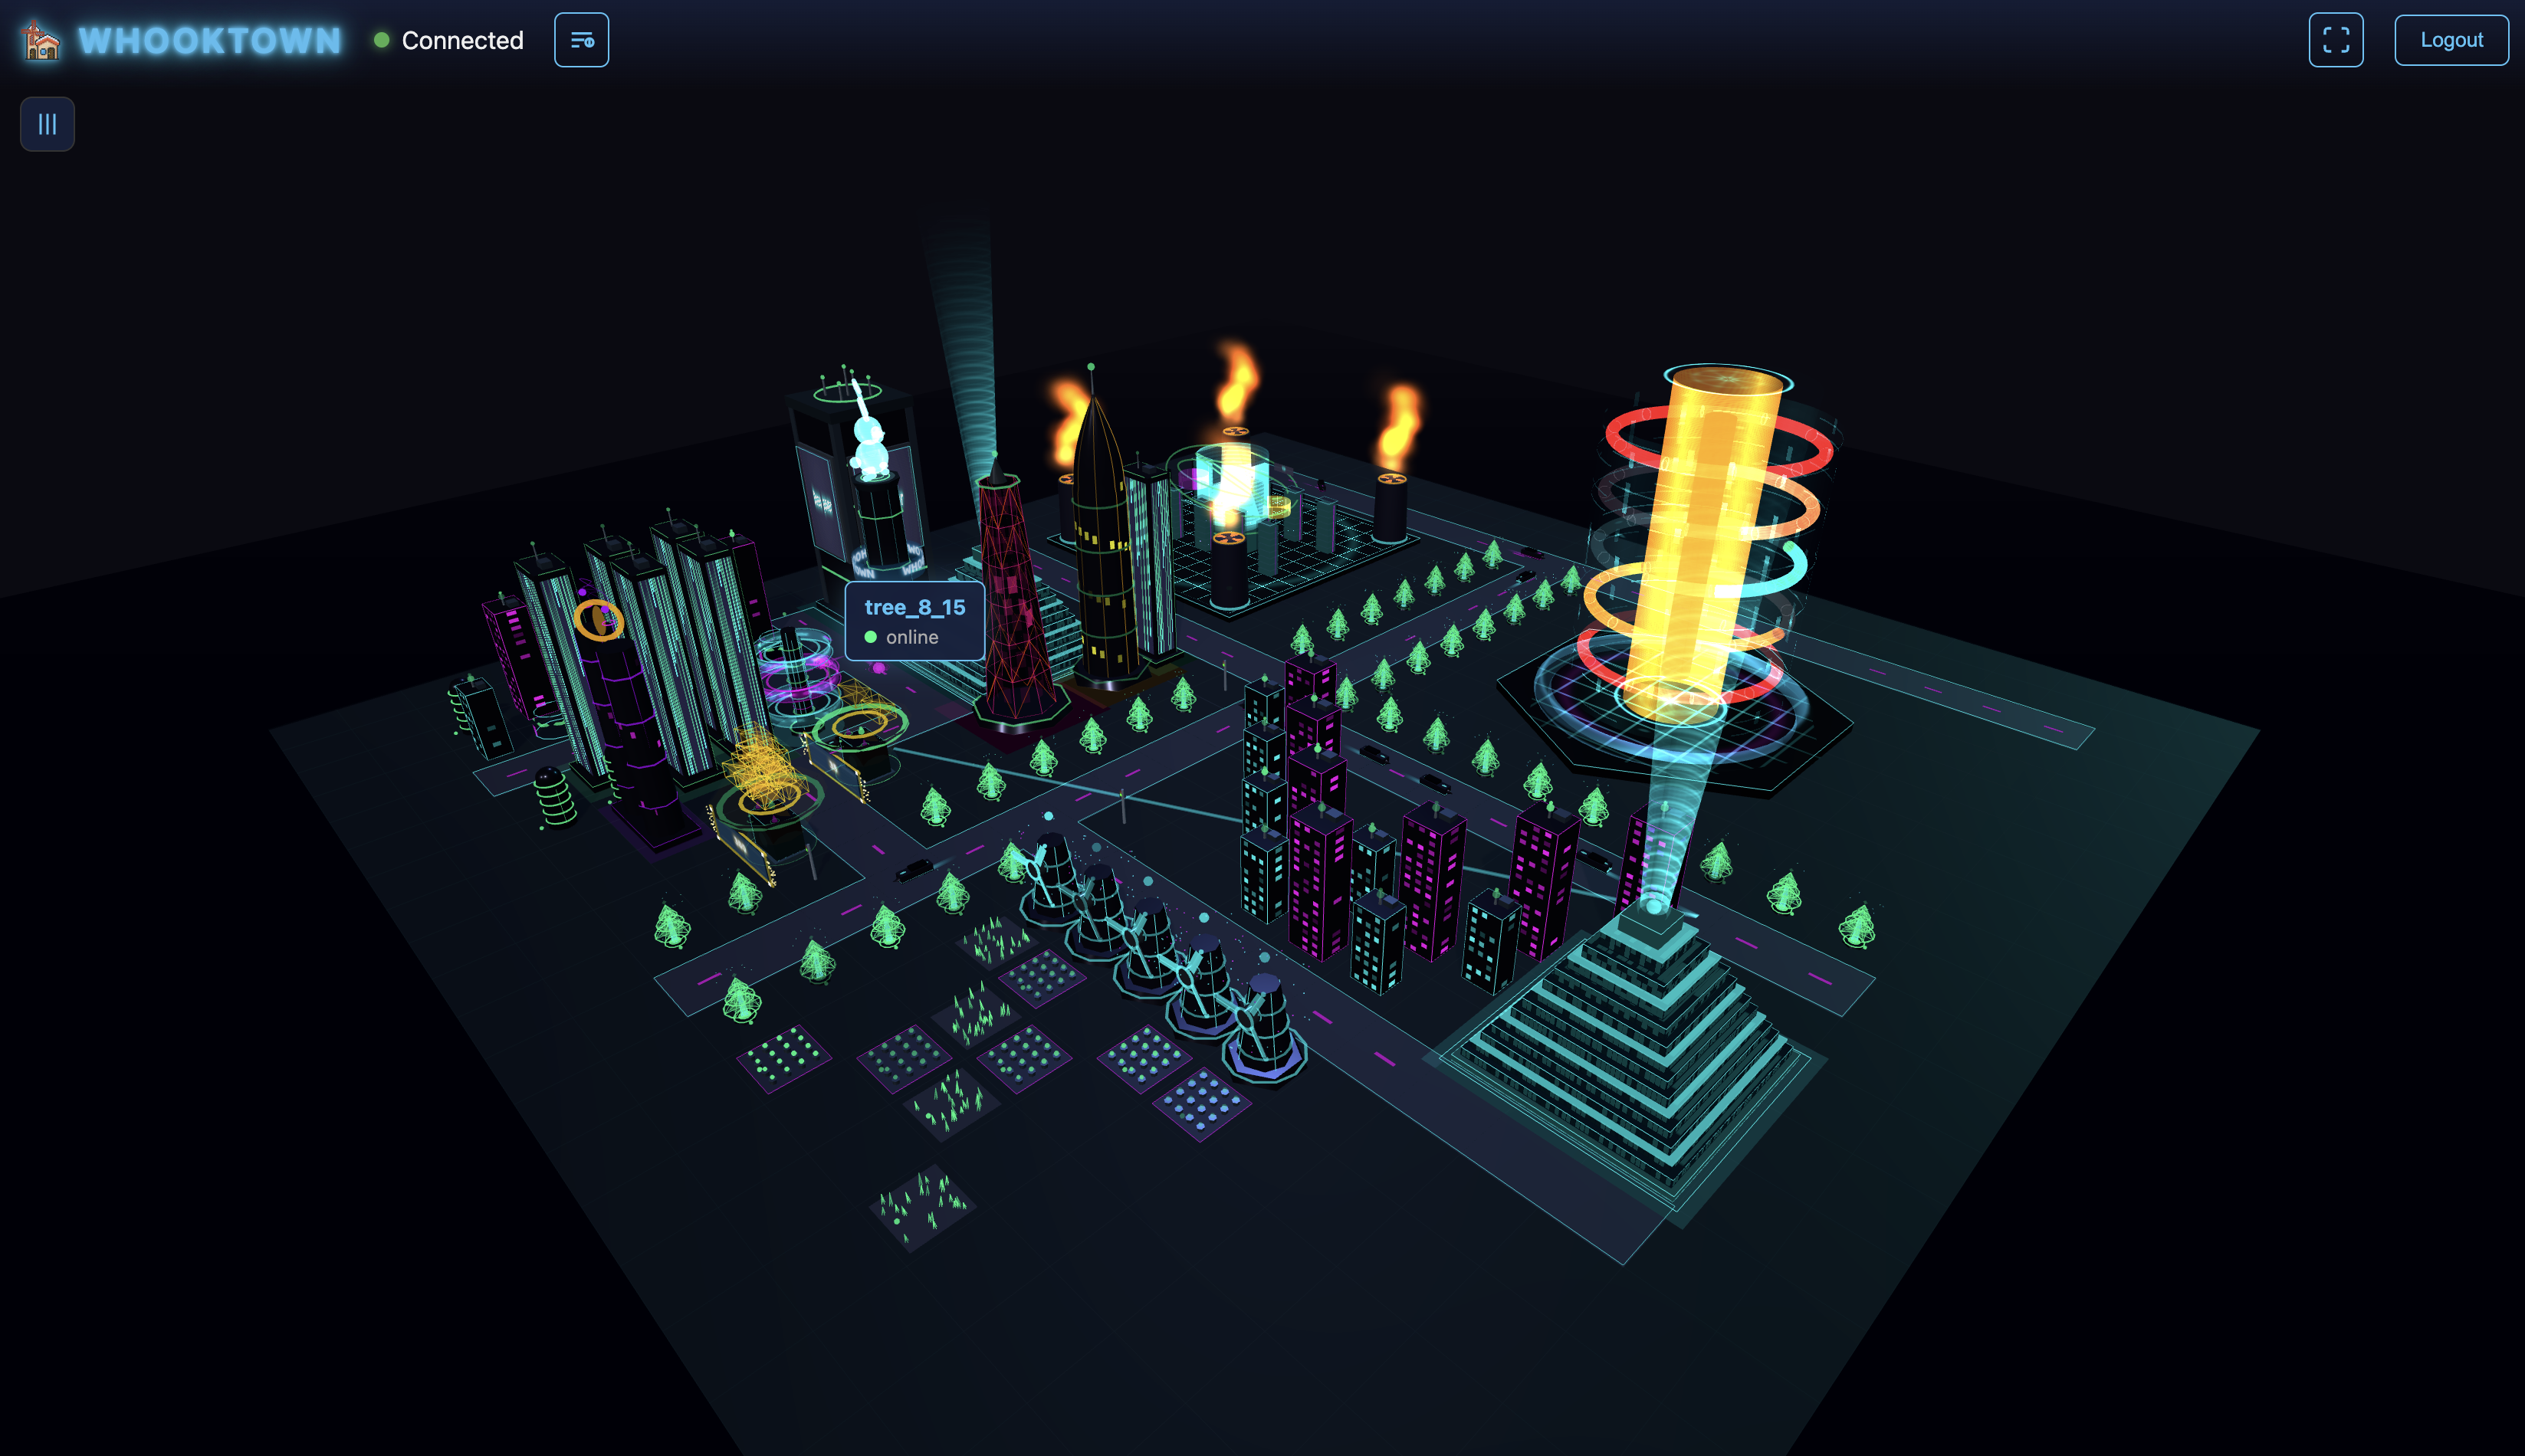
WhookTown transforms your servers, services, and infrastructure into a beautiful cyberpunk cityscape. Each building represents a component of your system, and its visual state reflects real-time metrics from your monitoring tools.
What is WhookTown?
WhookTown is a monitoring visualization platform that turns abstract infrastructure data into an intuitive 3D experience:
- Buildings = Your servers, services, databases, applications
- Building status = Online (green), Warning (orange), Critical (red), Offline (grey)
- Activity animations = CPU load, request rate, or any metric you choose
- Traffic = Data flow between your services (Tron-style light cycles)
Key Features
Map Builder
Design your city layout with 27 building types. Place windmills, data centers, pyramids, skyscrapers, and more on a customizable grid.
Control Center
Monitor and control your buildings in real-time. Change status, adjust activity levels, and organize buildings into groups.
Workflow Automation
Create visual workflows that automatically update building states based on sensor inputs. Connect logic gates (AND, OR, NOT) to trigger actions.
3D Scene
Experience your infrastructure in an immersive 3D environment with multiple camera modes and animated traffic.
CLI Tool
Automate everything from the command line. Send sensor data, manage layouts, and control the scene with the wt command.
Quick Links
-
Create your account and build your first city in minutes
-
Learn to use the dashboard, map builder, and control center
-
Navigate the 3D world and understand building types
-
Automate with the
wtcommand-line tool -
Integrate your monitoring tools with the sensor API
-
Compare Free, Starter, and Premium plans
URLs
| Service | URL |
|---|---|
| Website | www.whook.town |
| Web App | app.whook.town |
| 3D Scene | scene.whook.town |
| Documentation | docs.whook.town |
Need Help?
- Check the Getting Started guide for a step-by-step tutorial
- Browse the documentation sections for detailed feature guides
- Contact support at support@whook.town